
Quick start
LiveRun your first market scan
Begin with one product, one reporting market and one decision. Keep source period and coverage visible as you compare results.
- 01
Define
Choose a country, product or HS code and write down the decision you need to support.
- 02
Compare
Open a relevant dashboard, set the period and compare demand, growth and concentration.
- 03
Verify
Use AI for explanation, then check its evidence, period and caveats before acting.
1. Orient in the dashboard
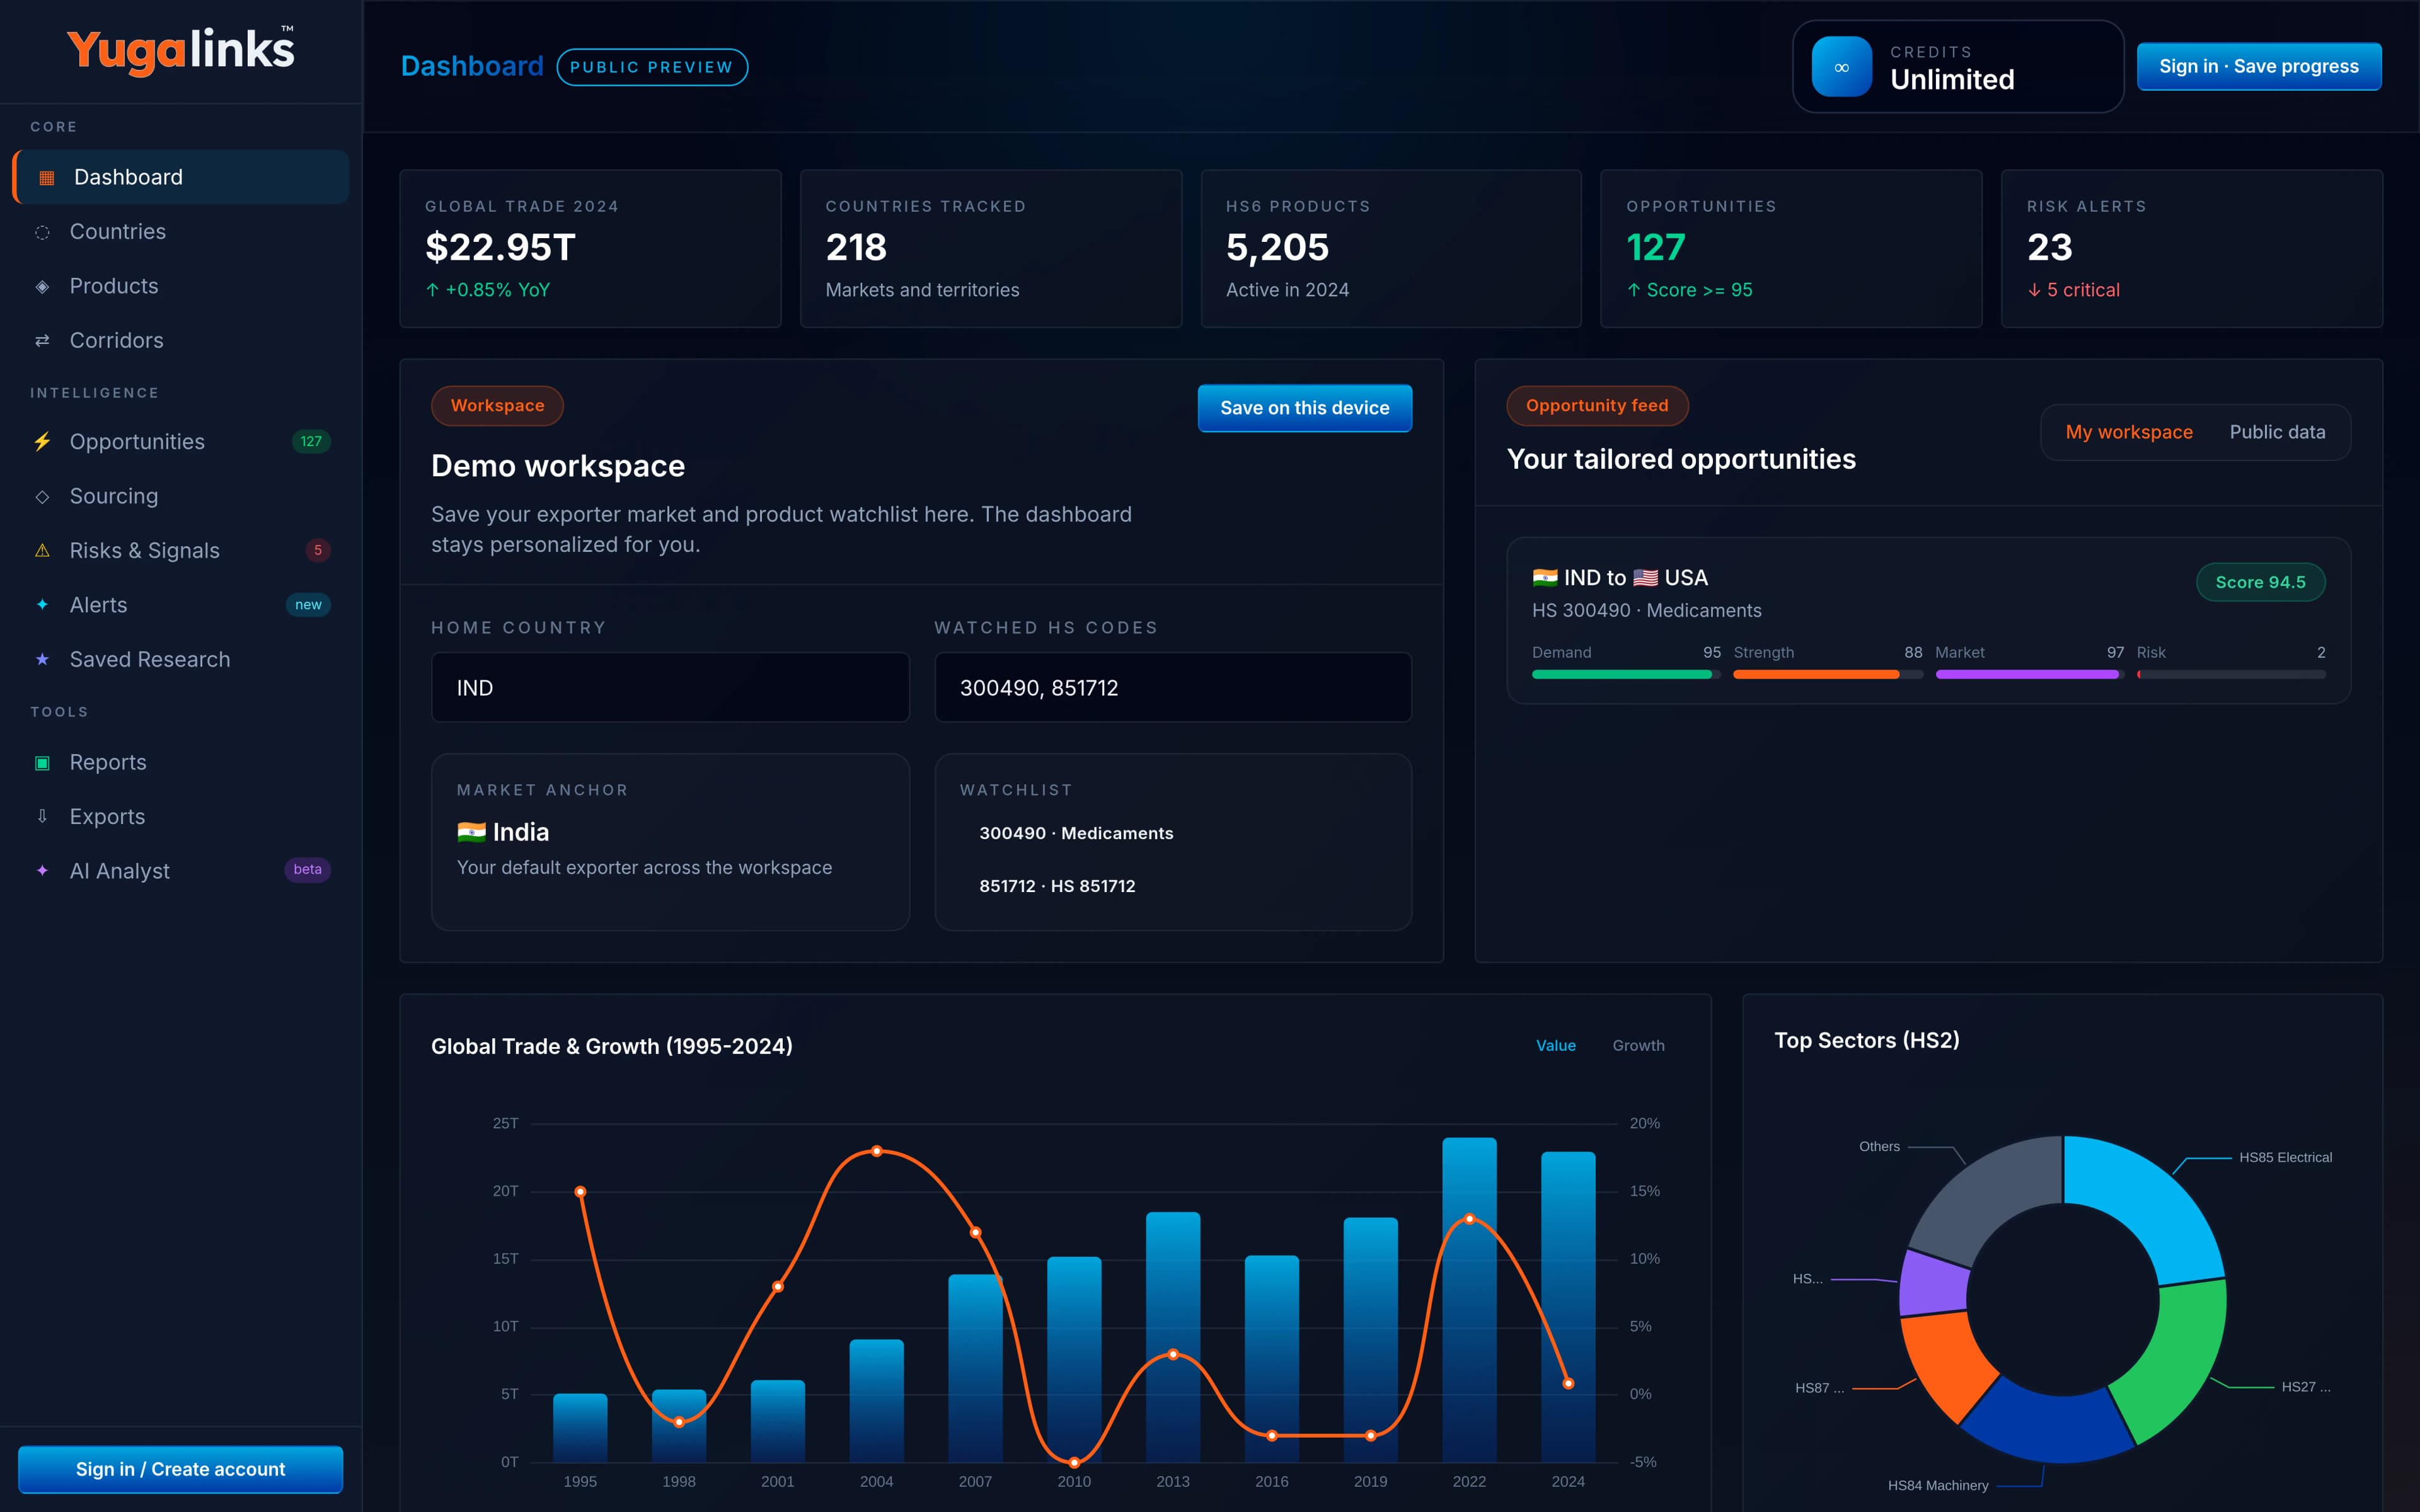
LiveUse the overview to establish scale and direction before narrowing the analysis. Confirm selected period, reporting currency and active filters.
- Check KPI periods before comparing values.
- Move from global totals into a country, product or corridor.
- Treat growth and market share as context, not a recommendation.
2. Compare markets
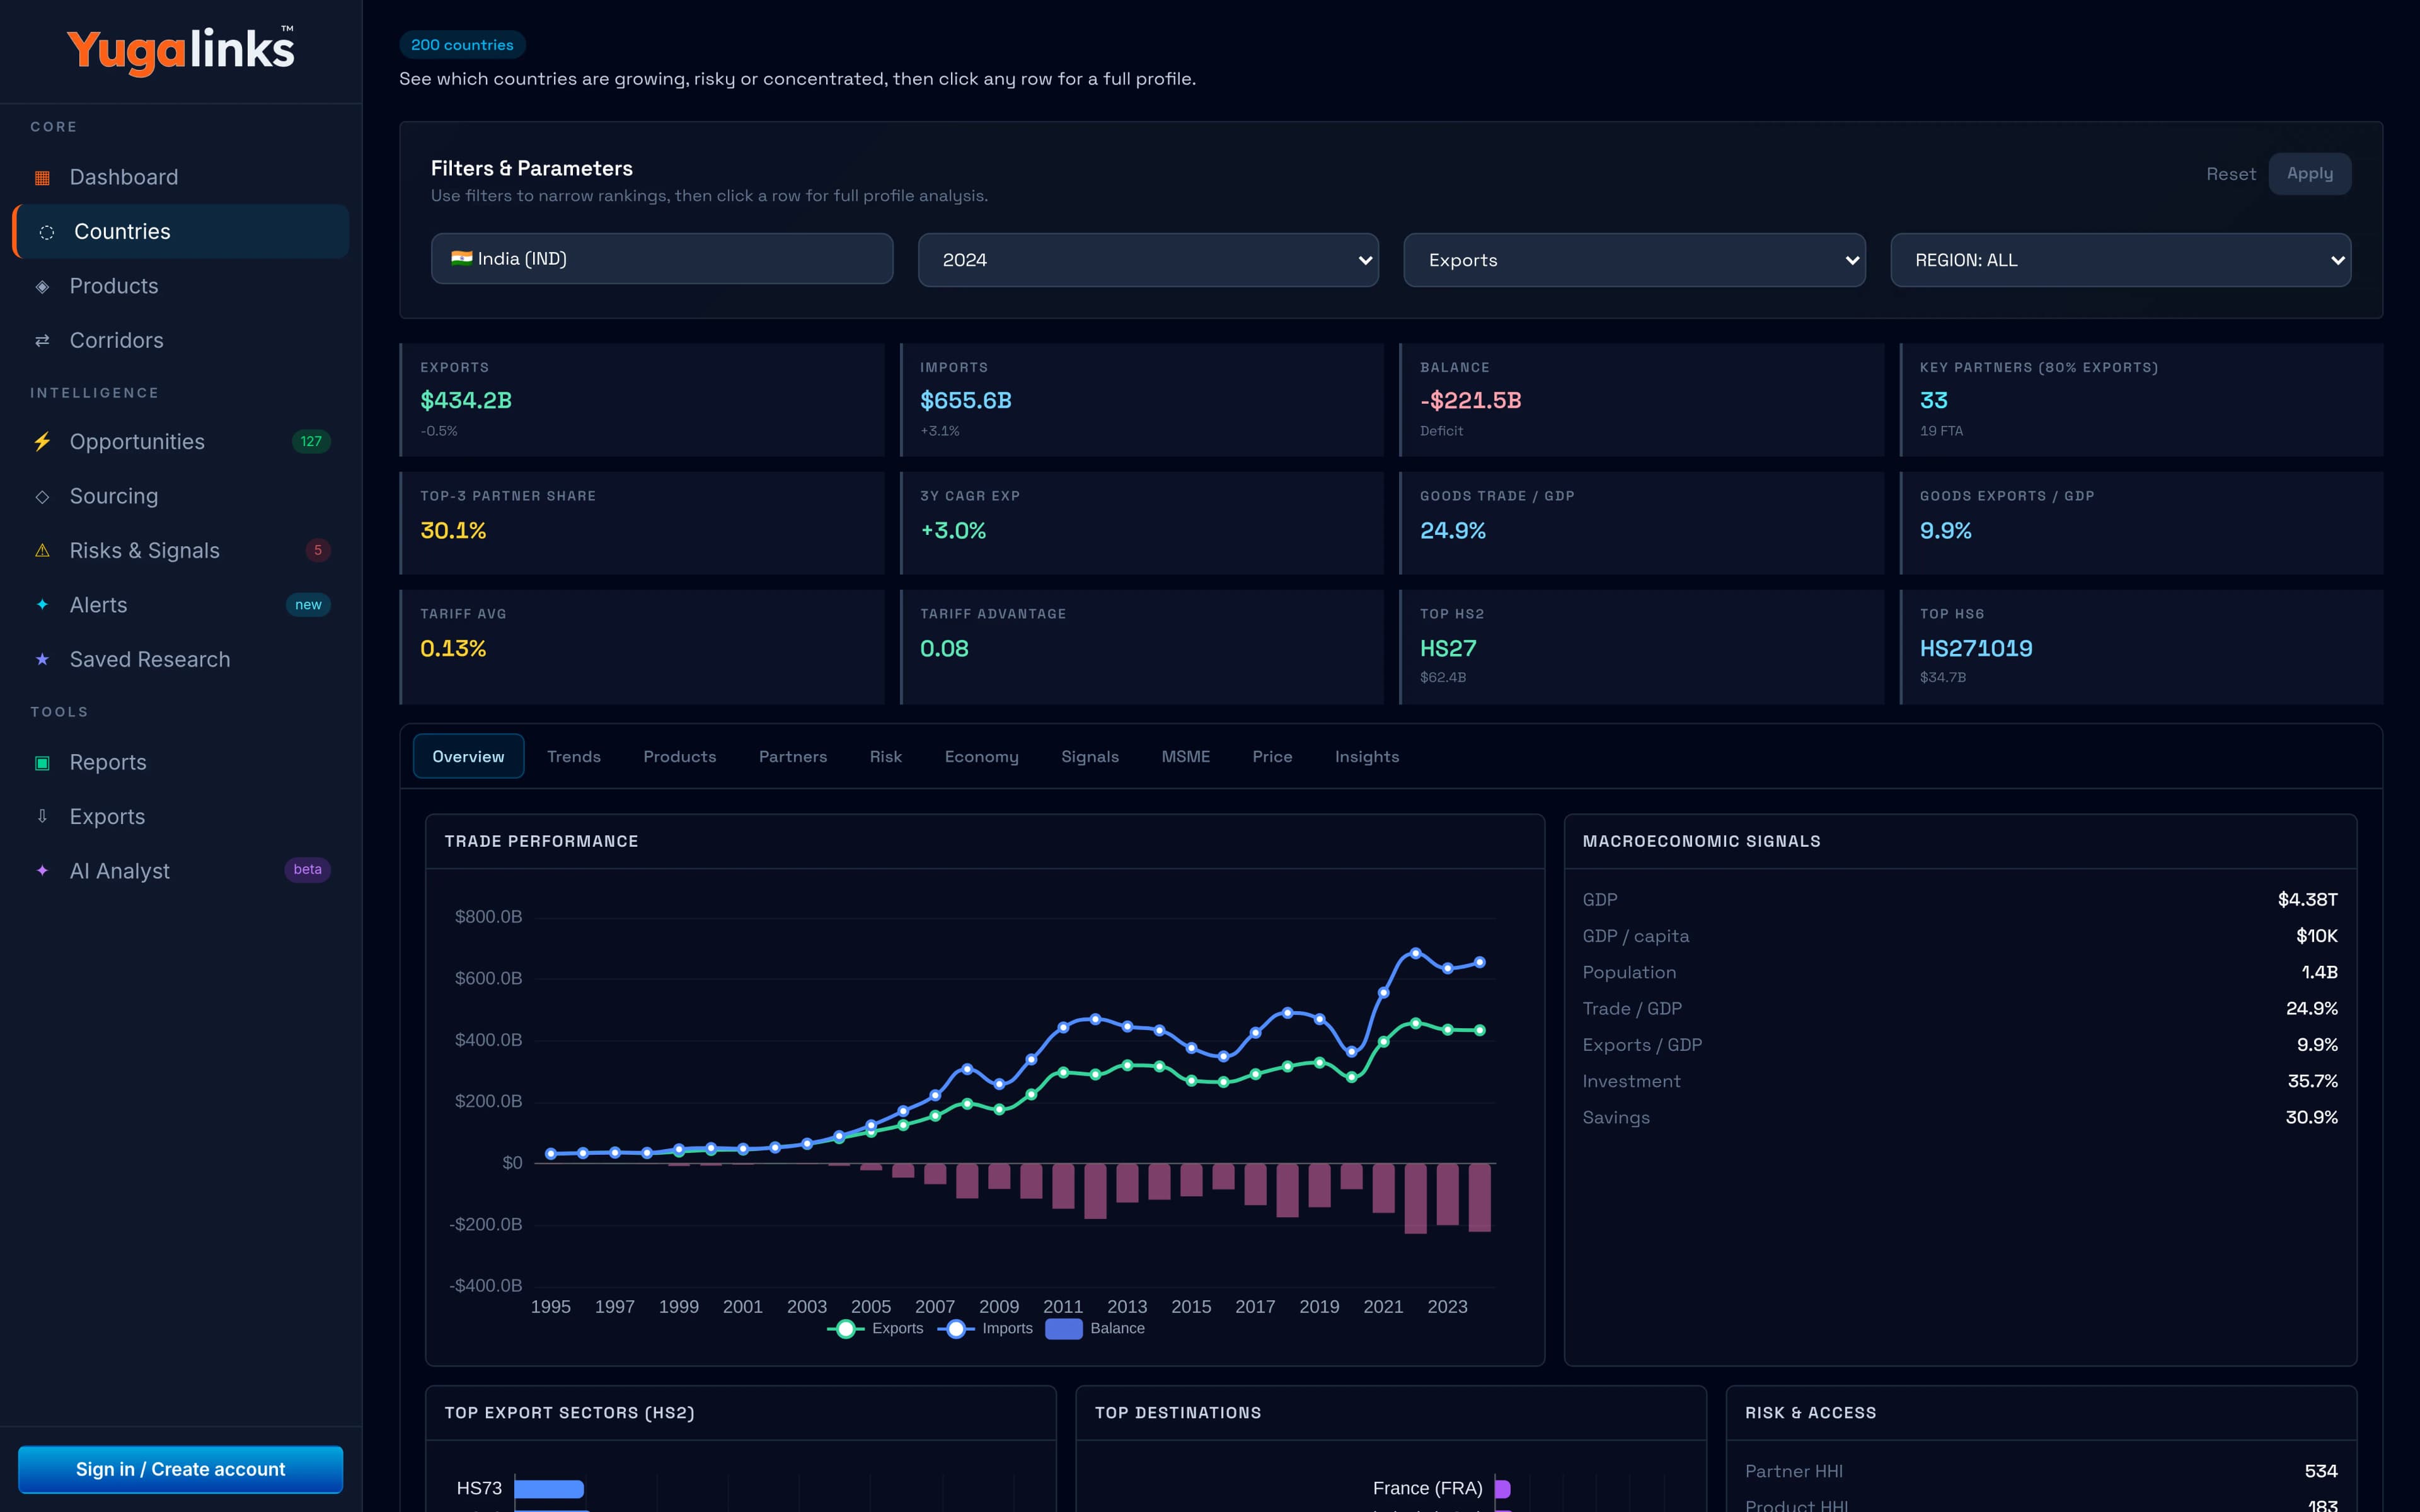
LiveCountry research combines trade scale with partner, product and market context. Keep comparisons like-for-like by holding year, flow and classification constant.
Open country research ↗3. Ask the AI analyst
BetaAsk focused questions with a product, market and period. A useful answer states the evidence used and its limitations. AI output can be wrong and should not be your sole basis for a decision.
Read responsible AI guidance ↗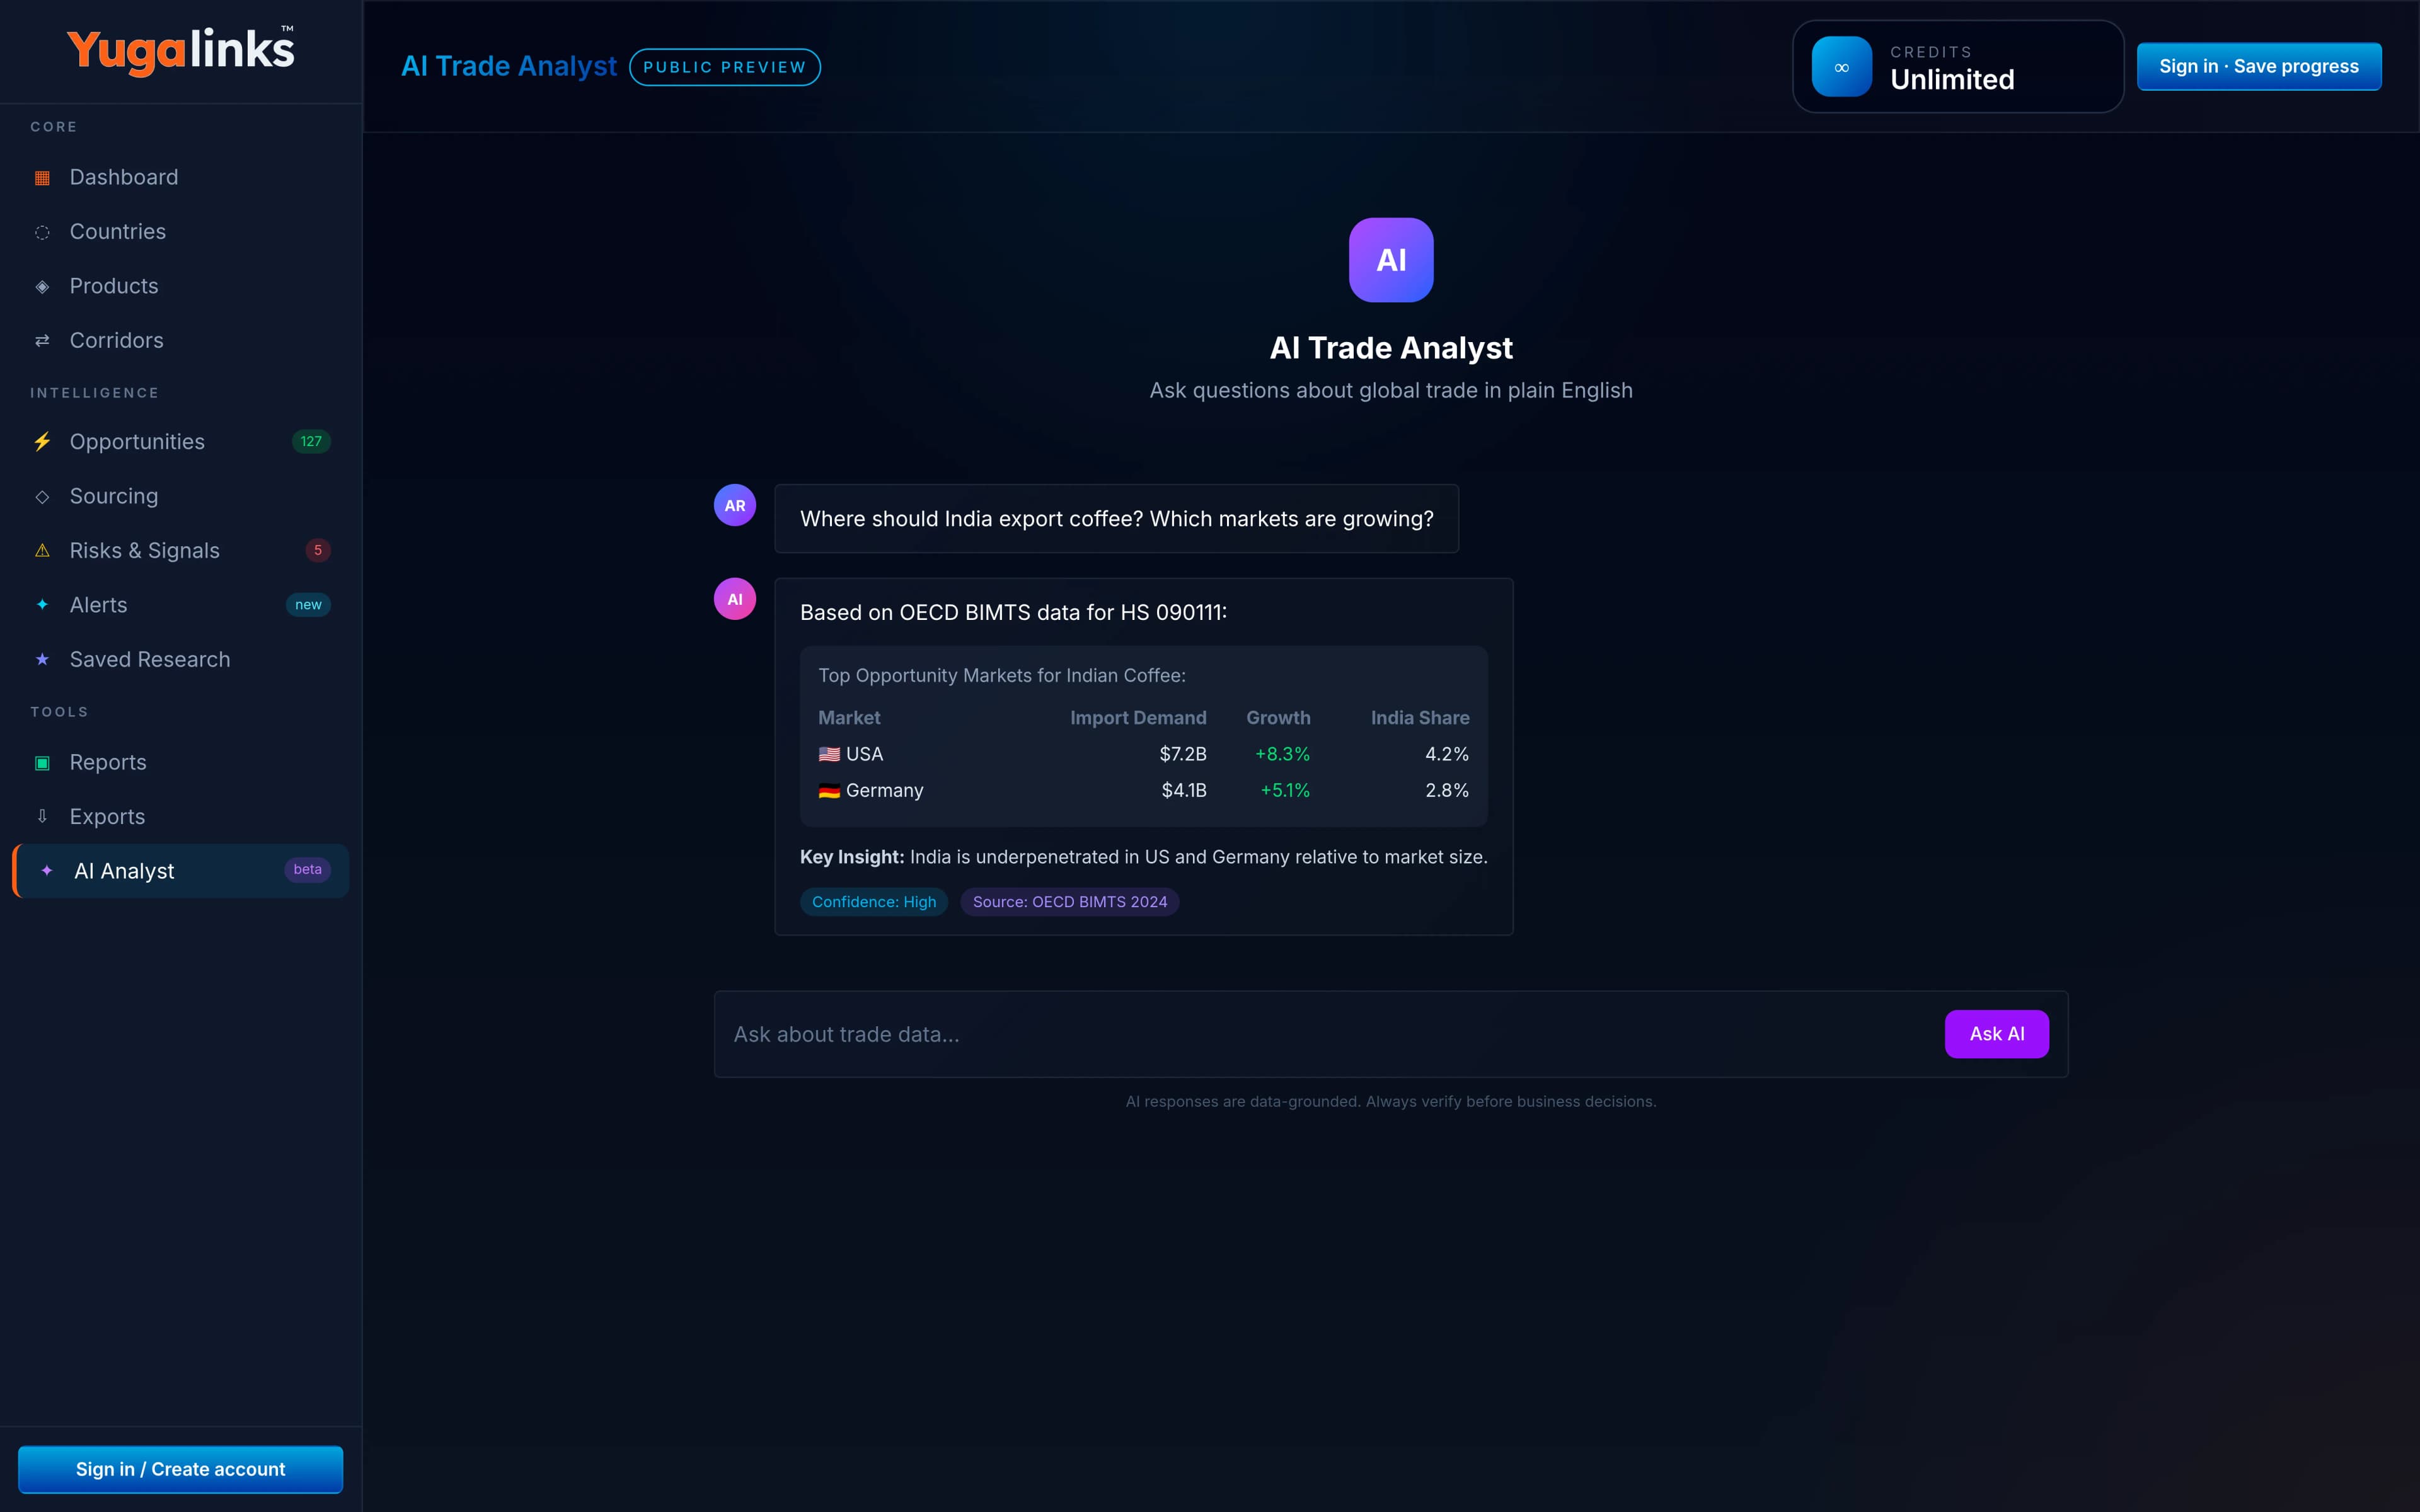
Read metrics with context
Live- Growth & CAGR
- Direction over a stated interval; sensitive to the start year and revisions.
- Market share
- Relative position within a defined market, product and period.
- Concentration
- How strongly flows depend on a small number of products or partners.
- Opportunity indicators
- Research prompts, not forecasts or guarantees of commercial success.
Reports & exports
PlannedReport generation and expanded exports are planned workflows. Availability and plan limits will be documented when these features are released.
Ask a documentation question ↗