Country Intelligence
Understand a country's imports, exports, major products, trading partners and long-term trade patterns.
Global Trade Intelligence Platform
Yugalinks turns global trade evidence into practical market intelligence for MSMEs, growing exporters and the teams that support them.
Compare demand, competitors, pricing, access and risk across countries, products and trade corridors, then ask follow-up questions in natural language.
Grounded in reported trade evidence, with sources, years and limitations kept visible.
—
merchandise trade
—
2024 movement
200+
reporting markets
Leading exporters
Reported 2024
Loading trade evidence
Loading trade evidenceRecent global movement
Loading market movement
Loading market movementBillions
Indexed analytical rows
312M+
Reported trade observations
200+
Countries
5,300+
HS6 products
1995–2024
Historical coverage
One connected research environment
Yugalinks combines structured data, interactive analytics and AI-assisted explanation across multiple research views.
View the platform →Understand a country's imports, exports, major products, trading partners and long-term trade patterns.
See where a product is traded, which markets are growing and which countries currently supply them.
Study trade between two countries and examine product-level movement across that corridor.
Compare markets using demand, growth, supplier mix and other decision-support signals.
Compare supplier countries, concentration and alternative sourcing options.
Ask a question in natural language and continue into the supporting data, dashboards and explanation.
Built for people making cross-border decisions
Whether the goal is to identify demand, compare suppliers, study market movement or investigate trade opportunities, Yugalinks helps users work from data to clearer decisions.
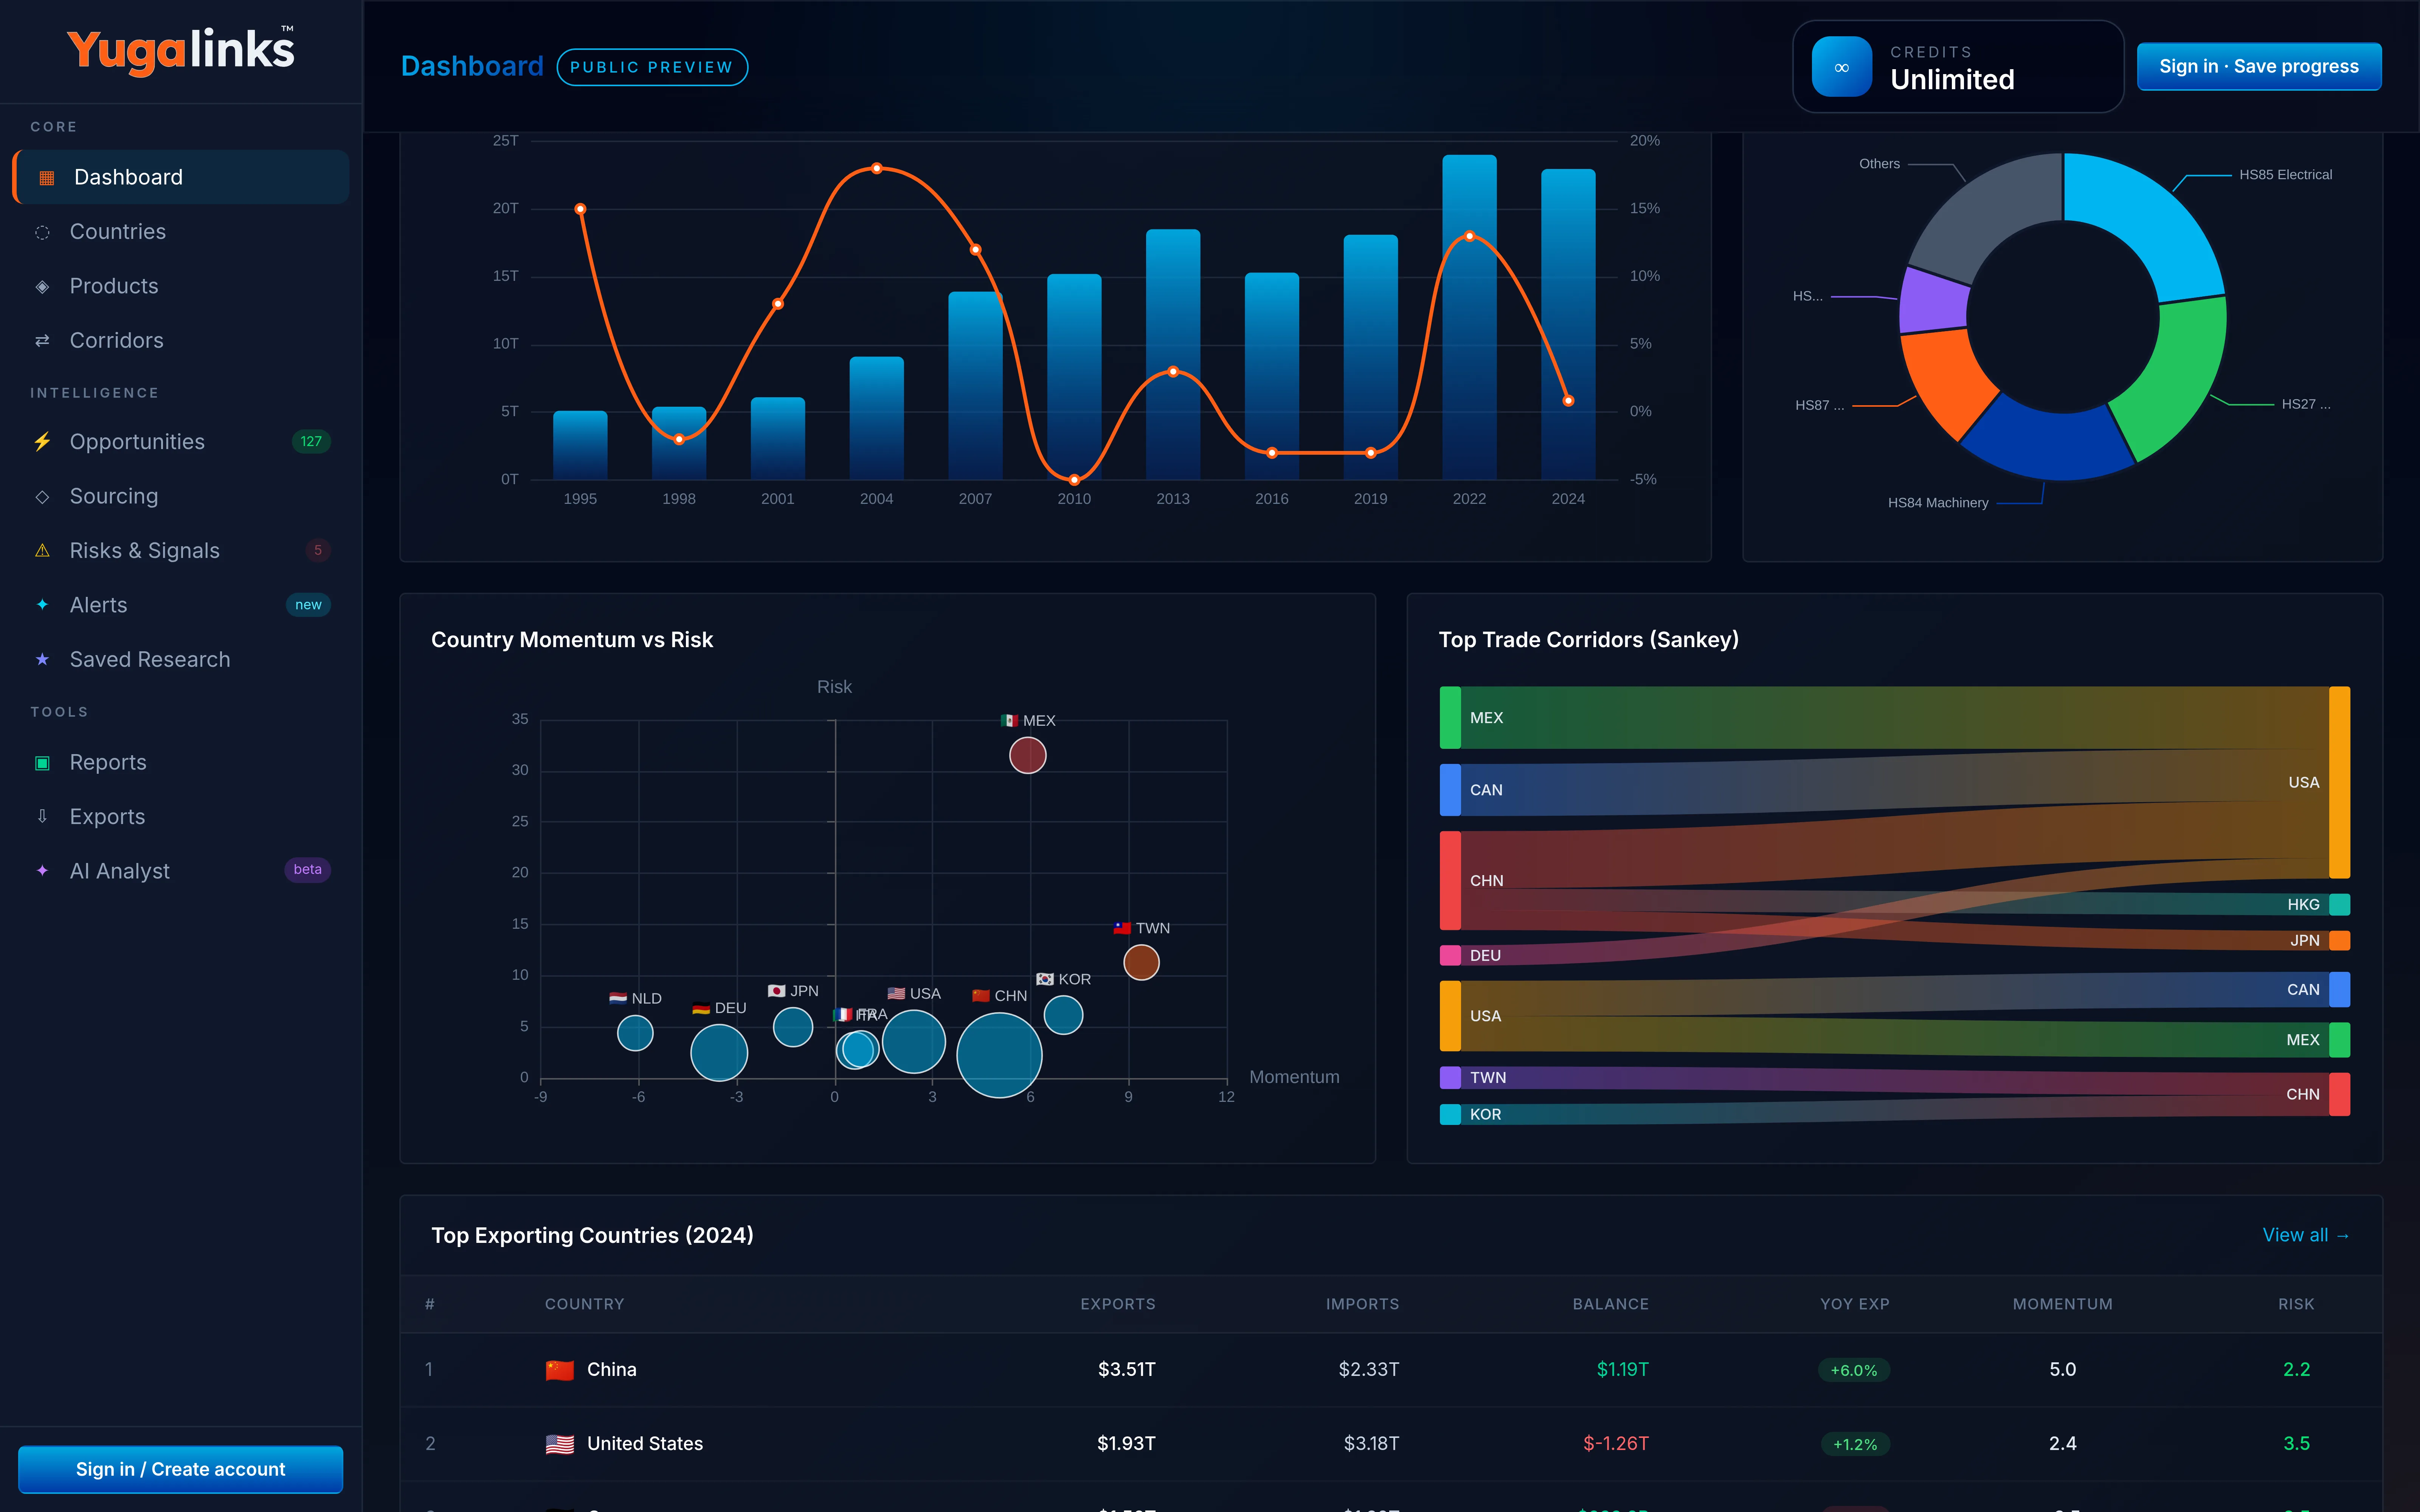
Live platform evidence
Start with the live market picture, then move into country, product, corridor and AI-assisted research without losing the evidence trail.
—
Merchandise trade / 2024
—
2024 annual movement
1995–2024
Reported history
Loading trade history
Loading trade historyAI Trade Analyst
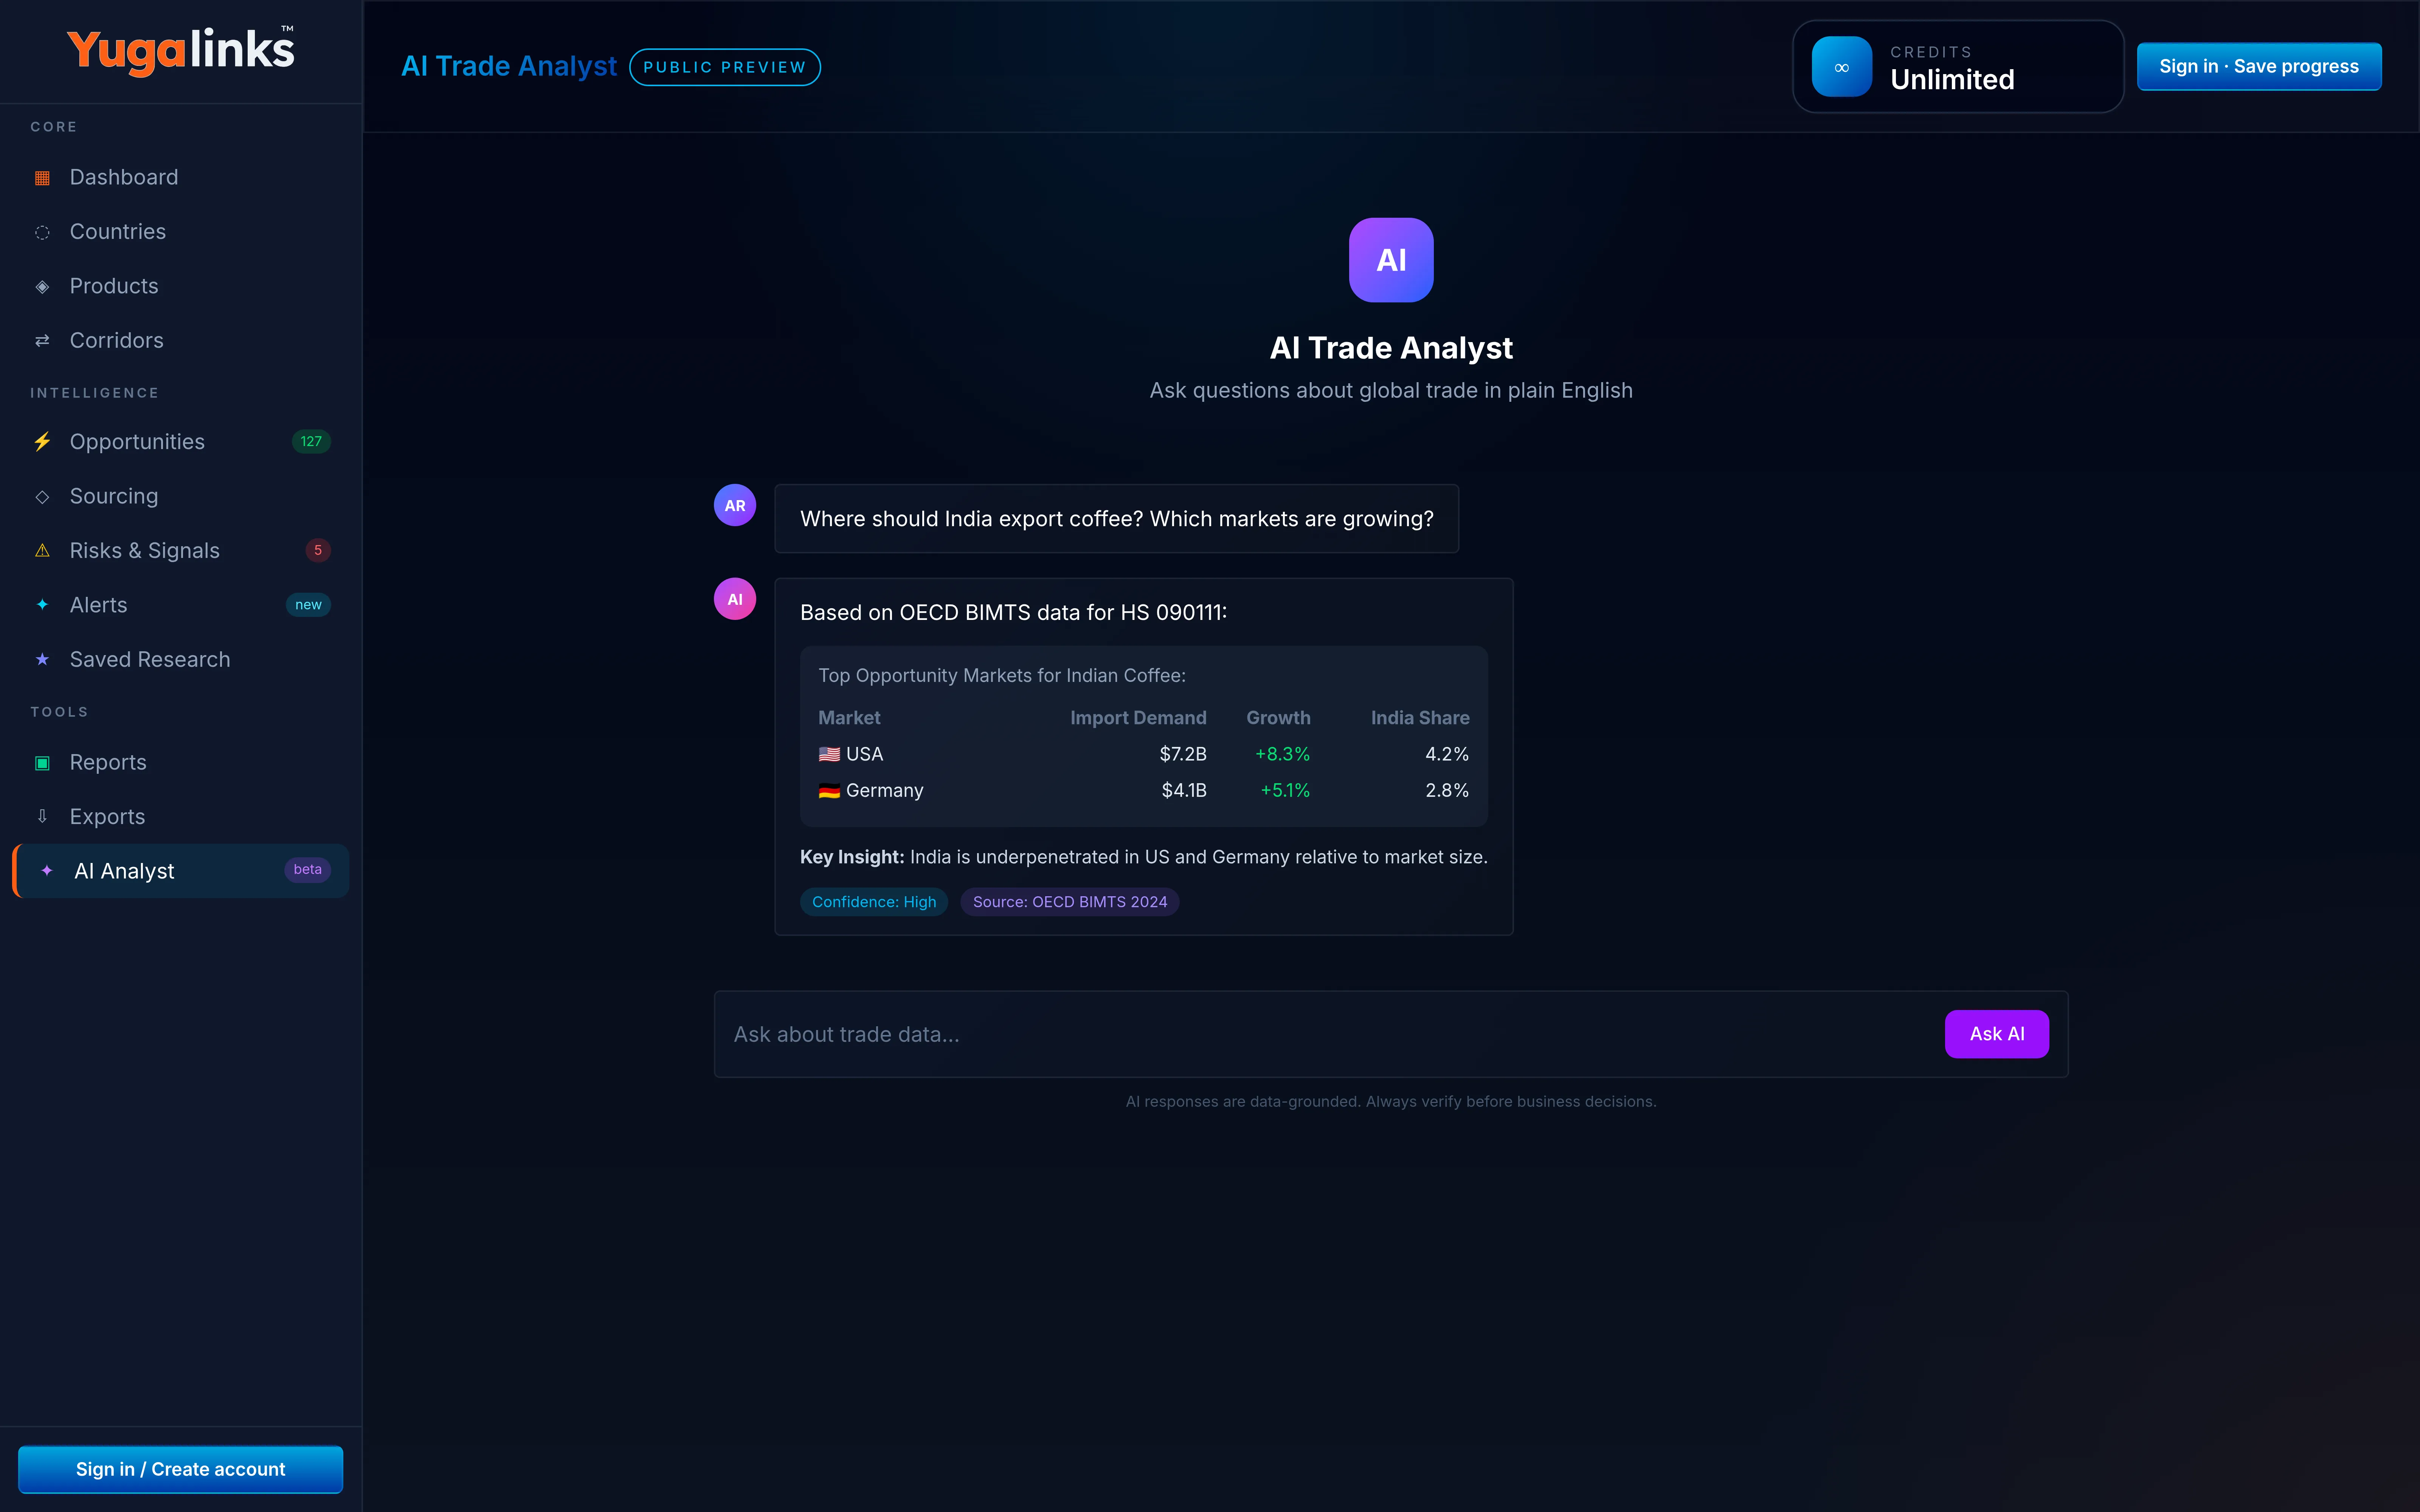
The AI Trade Analyst works on top of Yugalinks data and analytics. It helps users ask trade questions in natural language, identify relevant countries, products and periods, explain charts and metrics, compare markets and suggest next research steps.
Every answer keeps reported evidence, derived metrics and recommended actions distinct.
From fragmented data to structured research
Trade datasets are gathered from recognised sources, aligned into consistent structures and transformed into dashboards and explanations users can inspect.
Trade datasets are gathered from recognised public and institutional sources.
Country names, product codes, years and trade-flow structures are cleaned and aligned.
Yugalinks calculates market size, growth, trade share, concentration and related indicators.
Results are presented through dashboards, charts, rankings and comparisons.
AI-assisted natural-language tools help users understand the analytics and continue research.
Research tools should show their evidence
Coverage and freshness vary by country, product and publisher. Important outputs should show the source, reporting year, dataset, methodology, assumptions and known limitations.
Source
Reporting year
Dataset
Methodology
Assumptions
Limitations
Flexible access
Compare public trade intelligence across countries, products and corridors, then ask the AI Analyst follow-up questions. No signup is needed to start exploring.
Explore countries, products, HS codes and trade corridors. Compare demand and suppliers. Use AI-assisted explanations to understand the evidence behind the charts.